
Overview
The Auditor-General, Margaret Crawford released her report today on the results of financial audits of NSW universities for the year ended 31 December 2017. No qualified audit opinions were issued for any university and the quality and timeliness of financial reporting continues to improve.
1. Executive summary
This report analyses the results of our audits of financial statements of the ten NSW universities and their controlled entities for the year ended 31 December 2017. The table below summarises our key observations.
1. Financial reporting and performance
| Financial reporting |
The financial statements of all ten NSW universities and 66 out of 69 of their controlled entities received unmodified audit opinions. The number of uncorrected misstatements continues to decrease. Two universities improved the readability and understandability of their financial statements by simplifying their disclosures. Six universities finalised their financial statements earlier than in previous years. Eight universities are yet to quantify the impact of new accounting standards applicable in future years. An accounting issue was identified relating to the recognition and measurement of payroll tax liabilities on employees' defined benefit superannuation contributions payable to the superannuation funds. |
| Recommendation: NSW universities should clarify the recognition and measurement of their liability for payroll tax on their defined benefit superannuation obligations before 31 December 2018. | |
| Source of revenue from operations |
Government grants as a proportion of total revenue decreased over the past five years by 6.4 per cent. Revenue from overseas student course fees increased by 23 per cent in the last year and contributed $2.8 billion to the NSW university sector in 2017. Revenue from overseas students from four countries comprised 37 per cent of total student revenues for all NSW universities. |
| Recommendation: NSW universities should assess their student market concentration risk where they rely heavily on students from a single country of origin. This increases their sensitivity to economic or political changes in that country. | |
| The research income of NSW universities was $1.1 billion in 2016 and has grown by 9.8 per cent between 2012 and 2016. | |
|
Other revenues |
Total philanthropic revenue increased by 1.0 per cent from 2016 to $151 million in 2017. Average investment returns fell from 7.0 per cent in 2013 to 5.8 per cent in 2017, while total investments grew to $5.4 billion in 2017 from $3.5 billion in 2013. Low interest rates have made investment in fixed income assets less attractive for universities. Over the last five years universities have increased their investment in non-fixed income (or market based) assets by 67.1 per cent. Most NSW universities have established investment governance frameworks. |
| Financial sustainability indicators |
Operating expenditure per equivalent full-time student load (EFTSL) increased by 3.0 per cent in 2017. For six universities, the growth in operating expenditure has exceeded the growth in operating revenue, reducing operating margins. The risk associated with narrowing margins is compounded where universities have a high reliance on student revenues from a single source. Sudden changes in demand can challenge the ability of those universities to adjust their cost structures. Eight universities have current ratios greater than one in 2017. |
| Controlled entities | Sixteen of the universities' 58 controlled entities that operate business activities reported losses in 2017 (15 in 2016). Overall, the financial performance of controlled entities operating business activities was positive, but results in 2017 were lower than in 2016. |
2. Teaching and research
| Achieving Australian Government target |
NSW universities met the Australian Government target of having 40 per cent of 25 to 34 year-olds with bachelor degrees ten years earlier than the original target date of 2025. The proportion of 25 to 34 year-olds in NSW holding a bachelor degree increased to 43.4 per cent in 2017 |
| Graduate employment rates |
Seven universities exceeded the national average for full-time employment rates of their undergraduates. Four universities exceeded the national average for full-time employment rates of their postgraduates. |
| Student enrolments by field of education | NSW universities have increased enrolments in fields of study that align with known skills shortages in NSW identified by the Australian Government for 2016 and 2017. |
| Achieving diversity outcomes | NSW universities agreed to targets set by the Australian Government for enrolments of students from low socio-economic status (SES) and Aboriginal or Torres Strait Islander backgrounds. |
| Low SES students Three universities exceeded the target of 20 per cent of low SES student enrolments in 2017. At the current rate, it is unlikely most universities will reach the agreed target by 2020. |
|
| Indigenous students Six universities met their targets in 2017. The target is having a growth rate in the enrolment of Indigenous students that is more than 50 per cent higher than the growth rate of non-Indigenous student enrolments. |
3. Financial controls and governance
| Internal control findings | Eighty-three internal control deficiencies were identified during our audits, of which 40 related to Information Technology (IT). |
|
High risk |
|
|
Moderate risk Recommendation: NSW universities should ensure controls, including information technology controls, are properly designed and operate effectively to protect intellectual property, staff and student data, and assets. Universities should rectify identified deficiencies in a timely manner. |
|
| Cyber security |
Our audits identified opportunities to improve cyber security controls and processes to reduce risks, including risks relating to financial loss, reputational damage and breaches of privacy laws. Recommendation: NSW universities should strengthen their cyber security frameworks to manage cyber security risks. This includes developing:
|
| Use of credit card and work-related travel |
All NSW universities had appropriate published policies on the use of credit cards and have internal controls and processes to implement those policies. The risk of unauthorised use can be mitigated by regularly monitoring use, and reporting instances of abuse and non compliance for investigation and disciplinary action. |
2. Introduction
This report focuses on our observations on the common issues identified in our audits of the financial statements of the ten NSW universities and their controlled entities in 2017. The universities and controlled entities are listed in Appendix three and four respectively.
The report provides our analysis of universities’ results and findings in the following areas:
- Financial reporting and performance
- Teaching and research
- Financial controls and governance.
2.1 Changes to the university sector
Over the past five years, various higher education reforms have been proposed by the Australian Government to manage the growing cost of tertiary education. The Australian Government recently announced a freeze on the total amounts they will pay under the Commonwealth Grant Scheme (CGS) to fund bachelor degree courses for 2018 and 2019. That announcement indicated the Commonwealth government intends to freeze grants at 2017 funding levels. This will put pressure on the universities to expand other sources of revenue and contain their costs.
2.2 Snapshot of NSW Universities
A snapshot of NSW universities for the year ended 31 December 2017 is shown below.


2017 has shown an increase in the number of students attending NSW universities. The impact of increased student numbers on the financial results and operating margins for the year is analysed later in this report.

Source: provided by universities (unaudited).
3. Financial reporting and performance
Accurate and timely financial reporting is important for universities to make efficient and effective economic decisions. Sound financial performance provides the platform for universities to deliver high quality teaching and research outcomes.
This chapter outlines our audit observations on the financial reporting and performance of NSW universities for 2017.
| Observation | Conclusion or recommendation |
| 3.1 Financial reporting | |
| Audit results | |
| The financial statements of all ten NSW universities and 66 out of 69 of their controlled entities received unmodified audit opinions. | Two controlled entities did not fully comply with the financial reporting and audit requirements of the Public Finance and Audit Act 1983 as they did not submit their financial statements to the Auditor-General. One of these entities was audited under the requirements applicable in its foreign jurisdiction. A third controlled entity submitted financial statements, but only after the statutory due date. |
| Quality and timeliness of financial reporting | |
| The number of uncorrected misstatements continues to decrease. | The quality of financial statements of the universities improved in 2017. |
| Two universities simplified disclosures in their financial statements. | The financial statements of the University of Sydney and Macquarie University are more concise, readable and understandable than those of other universities. |
| Six universities finalised their financial statements earlier than in previous years. | Universities that performed aspects of early close procedures improved the timeliness of their financial reporting and helped us conclude our audits earlier. |
| Eight universities are yet to quantify the impact of new accounting standards applicable in future years. | The two universities that have assessed the impact of the new accounting standards believe the impact will be material. |
| An accounting issue was identified relating to the recognition and measurement of payroll tax liabilities on employees' defined benefit superannuation contributions payable to the superannuation funds. | Recommendation: NSW universities should clarify the recognition and measurement of their liability for payroll tax on their defined benefit superannuation obligations before 31 December 2018. |
| 3.2 Financial performance | |
| Sources of revenue from operations | |
| Government grants as a proportion of total revenue decreased over the past five years by 6.4 per cent. |
The Australian Government announced funding freezes to Australian Government grants revenue for the next two years. Universities are expanding other revenue streams to decrease their reliance on grant funding. The revenue stream that has increased the most significantly over the past five years is overseas student revenue. |
| Revenue from overseas student course fees increased by 23 per cent in the last year and contributed $2.8 billion to the NSW university sector in 2017. | Overseas student revenue exceeded domestic student revenue by 37 per cent, and comprised over a quarter of NSW universities' total revenues in 2017. The growth in overseas student revenue has not been shared equally in the sector. Some universities are more dependent on overseas student revenue than others. |
| Revenue from overseas students from four countries comprised 37 per cent of total student revenues for all NSW universities. | Recommendation: NSW universities should assess their student market concentration risk where they rely heavily on students from a single country of origin. This increases their sensitivity to economic or political changes in that country. Universities' data shows as much as 71 per cent of their overseas student revenue comes from a single country of origin. |
| Research income of NSW universities was $1.1 billion in 2016 and has grown by 9.8 per cent between 2012 and 2016. | Two universities attracted 65.2 per cent of the total research income received by all NSW universities. |
| Other revenues | |
| Total philanthropic revenue increased by 1.0 per cent to $151 million in 2017. |
Philanthropic revenue has been increasing for the past five years. Two universities attracted 76.8 per cent of the total philanthropic dollars received by all NSW universities. |
| Average investment returns fell from 7.0 per cent in 2013 to 5.8 per cent in 2017, while total investments grew to $5.4 billion in 2017 from $3.5 billion in 2013. |
Universities have structured their investment portfolios between fixed and non-fixed income assets, seeking to optimise their returns in a low interest rate environment within the limits of their risk management strategies. Investment income is a significant source of revenue for some, but not all universities. Two universities' investment funds represented 52.3 per cent of the total investment funds of all NSW universities combined. |
| Low interest rates have made investment in fixed income assets less attractive for universities. Over the last five years universities have increased their investment in non-fixed income (or market based) assets by 67.1 per cent. | |
| Most NSW universities have established investment governance frameworks. | |
| Financial sustainability indicators | |
| Operating expenditure per equivalent full-time student load (EFTSL) increased by 3.0 per cent in 2017. | The universities that have been able to attract international students to grow their operational revenues have been able to leverage economies of scale to maximise their average margin per EFTSL. Other universities have had to rely on containing costs to achieve higher EFTSL margins. |
| For six universities, the growth in operating expenditure has exceeded the growth in operating revenue, reducing operating margins. The risk associated with narrowing margins is compounded where universities have a high reliance on student revenues from a single source. Sudden changes in demand can challenge the ability of those universities to adjust their cost structures. |
As the margin between operating revenue and operating expenditure decreases, operational results are more at risk from unexpected fluctuations, such as Australian Government higher education reforms and reduced overseas student enrolments. Smaller operating margins reduce the funds available to invest in upgrading infrastructure and implement corporate strategies to meet future challenges. |
| Eight universities have current ratios greater than one in 2017. | |
| Controlled entities | |
| Sixteen of the universities' 58 controlled entities that operate business activities reported losses in 2017 (15 in 2016). | Overall, the financial performance of controlled entities operating business activities was positive, but results in 2017 were lower than in 2016. |
| The total profit of controlled entities operating business activities decreased 5.5 per cent to $77.5 million in 2017 ($82.6 million in 2016). | Universities may be able to improve their overall performance by reassessing the viability of business ventures that continue to make losses and/or rely on them for financial support. |
| Eighteen controlled entities relied on guarantees of financial support from their parent entity in 2017 (19 in 2016). | |
3.1 Financial reporting
Audit results
We issued unmodified opinions on all the financial statements presented for audit
The 2017 financial statements of all ten NSW universities and 66 out of 69 of their controlled entities received unmodified audit opinions for the purposes of satisfying the requirements of the Public Finance and Audit Act 1983 (PF&A Act).
Two controlled entities did not comply with the requirements of the PF&A Act as they have not submitted financial statements to the Audit Office. One of these entities is based overseas and is audited by a private firm to satisfy local jurisdictional requirements. The parent university of the remaining controlled entity has initiated actions to comply with the requirements of the PF&A Act in 2018.
A third controlled entity submitted financial statements after the statutory due date and the audit is still in progress.
Financial results
NSW universities' aggregated net results for the past five years showed an increasing trend overall, although there were fluctuations. Net results decreased in 2015 mainly due to reduced government grants across the sector, as well as unrelated events at four large universities being one-off increases in impairment and depreciation.

NSW universities increased their aggregated surpluses by $72.5 million to $704 million in 2017, an increase of 11.6 per cent over the previous year. Six universities' (including the largest universities) net results improved in 2017, which contributed to a relatively stronger year.
The total income rose by $700 million to $10,114 million in 2017. This was mainly due to $592 million (12.7 per cent) increase in fee and charges offset by a decrease in Government grants of $15.0 million (reduction of 0.4 per cent).
The total expenditure grew by $627 million to $9,410 million in 2017. This was mainly due to increases of $311 million (6.2 per cent) employee benefit expenses, $84.0 million (19.4 per cent) scholarship expenses and $52.0 million (15.3 per cent) consultants and contractors expenses.
The graph below shows the net result of individual NSW universities for 2017.

Six universities improved their net results in 2017 from the previous year and three of them recorded increases greater than 40 per cent. The increases were primarily due to growth in fees and charges.
The expenditure of individual universities increased between 0.9 per cent and 11.1 per cent from 2016. The university with the lowest increase in expenditure also reduced its employee benefits expenses by 4.7 per cent.
Quality and timeliness of financial reporting
The number of uncorrected misstatements and disclosure deficiencies decreased
The quality of financial statements, as measured by reductions in the number and amount of identified misstatements and disclosure deficiencies, has continued to improve over the last three years. This is largely due to universities embracing early close initiatives and resolving potential accounting issues before year-end.
The number of uncorrected misstatements and disclosure deficiencies in the financial statements of NSW universities and their controlled entities over that period is shown in the table below.
| Year ended 31 December | 2017 | 2016 | 2015 |
|---|---|---|---|
| $5 million or greater | - | - | 1 |
| $1 million to $4,999,999 | 2 | 5 | 6 |
| $500,000 to $999,999 | 3 | 3 | 2 |
| Less than $499,999 | 13 | 19 | 39 |
| Total number of misstatements | 18 | 27 | 48 |
| Total number of disclosure deficiencies | 8 | 13 | 12 |
Two universities have simplified their financial statements disclosures
General purpose financial statements presented in traditional formats have become increasingly lengthy and complex, reducing the readers' ability to understand the information they present.
The Australian Accounting Standards Board has, through its disclosure initiative, promoted the importance of 'decluttering' or simplifying financial statements so the information they present is easier to understand.
The University of Sydney and Macquarie University simplified the disclosures in their financial statements in 2016, and continue to refine that presentation to produce shorter, more concise, readable and understandable financial statements.
This involves removing irrelevant disclosures about immaterial items, rearranging the accounting policy notes so they appear along with the relevant financial information, and using plain English to convey meaningful financial information about accounting policies, conventions and any practical expedients used in the preparation of the financial statements.
Six universities finalised their financial statements earlier this year
NSW universities met the statutory timetable for submission of their financial statements to allow timely completion of audits. Several universities improved on the previous year's timeframes.
All audit opinions were issued between 16 March 2018 and 20 April 2018. We issued our audit opinions on six universities' 2017 financial statements earlier than we did in 2016. One 2017 audit opinion was issued on the same date as in the previous year.

NSW universities have voluntarily adopted aspects of early close procedures to facilitate earlier completion of their financial reporting obligations. Early close procedures included preparation of proforma financial statements, early identification and resolution of potential accounting issues and completion of asset revaluations before year-end.
Thirty-five out of 66 controlled entities completed their audits earlier this year.
Eight universities are yet to quantify the impact of new accounting standards applicable in future years
The Australian Accounting Standards require entities to assess, and where possible, quantify the impact of accounting standards that have been issued but are not yet effective.
Important new accounting standards have been issued on the treatment of revenue from contracts with customers, revenue for not-for-profit entities, service concession arrangements, leases and financial instruments. These new standards were not effective for the year ended 31 December 2017. However, the two universities that have started to assess the potential impacts on their reported results believe the impacts will be significant.
The implementation of these standards will require a review of how student and third-party revenue is recognised. Similarly, how revenue is recognised under research and grant agreements may also change. The treatment of service concessions and leases, including peppercorn leases, will bring many more assets and liabilities on balance sheet. Universities' existing contracts will need to be analysed. Systems and processes may need to change to ensure the necessary information is captured and recorded.
An accounting issue was identified across the sector relating to the recognition and measurement of payroll tax liabilities on employees' defined benefit superannuation
The Audit Office identified that NSW universities had not recognised a liability in respect of payroll tax on their defined benefit superannuation liabilities at 31 December 2017. A Revenue NSW Ruling confirmed payroll tax is payable on contributions made to superannuation funds in respect of employees' services after 1 July 1996 under the Payroll Tax Act 2007.
Currently, the basis for the actuarial measurement of the liability and the ability to recoup payments from State and Commonwealth Governments remains unclear.
The University of Technology Sydney was the only university to provide for the payroll tax liability in its 31 December 2017 financial statements. Other universities determined the liability was not likely to be material and did not take up a liability in their 2017 financial statements.
The total employees' defined benefit superannuation contribution payable for NSW universities at 31 December 2017 was $5.9 billion. Under a 2014 Memorandum of Understanding (MoU), the Australian and New South Wales Governments agreed to fund this liability as it emerged and became payable to claimants of the fund. Accordingly, NSW universities recognise a receivable for the money they will eventually claim under the MoU in their financial statements, which has, for the most part, offset their liability.
NSW universities have agreed to clarify the recognition and measurement of payroll tax provision on their defined benefit superannuation contribution payable, including recoverability from Australian and State Governments for 2018.
3.2 Financial performance
Sources of revenue from operations
Over the past five years, various higher education reforms have been proposed by the Australian Government to manage the growing cost of tertiary education. The Australian Government announced in its December 2017 Mid-Year Economic and Fiscal Outlook a budget policy decision to freeze the total amounts they will pay under the Commonwealth Grant Scheme (CGS) to fund bachelor degree courses for 2018 and 2019. This policy will freeze the grants at their 2017 levels.
NSW universities have a diverse profile in terms of their background, growth levels, student population and access to other sources of revenue, such as commercial ventures, donations and investment income to support their activities.
Newer universities in high growth areas are more reliant on their operating results to fund their activities. The 'sandstone' universities, despite having generous donors and significant funds under management, face challenges renewing and maintaining ageing infrastructure.
The funding freeze will put pressure on all NSW universities. Those that are least well-off may find the strain significant, particularly if total expenditures continue to increase and operating margins decrease.
The graph below presents the aggregated total income for all universities from 2013 to 2017.

In the five years between 2013 and 2017, NSW universities' aggregated income increased by 25.9 per cent from $8.0 billion to $10.1 billion whilst expenditure increased by 33.7 per cent from $7.4 billion to $9.4 billion.
Total fees and charges during this period increased by 48.7 per cent whilst the government grants increased by 6.2 per cent. Three universities recorded greater than 30 per cent revenue growth over this period.
Six universities had greater than 50 per cent increase in fees and charges from 2013 to 2017 whilst three universities recorded less than 20 per cent growth.
The change in the government grants to individual universities varied from a drop of 3.7 per cent to a rise of 30.0 per cent during this period.
The following graph shows total income for individual universities for 2017.

Seven universities recorded greater than ten per cent growth in fees and charges in 2017 from previous year.
Four universities' government grants decreased from 2016 and the highest increase was 3.8 per cent.
Government grants as a proportion of total revenue decreased over the past five years
Total government grants for NSW universities decreased by $15.0 million to $3.5 billion in 2017. The major components of NSW universities' aggregated revenues, and the trend in terms of their relativities over the past five years are detailed below.
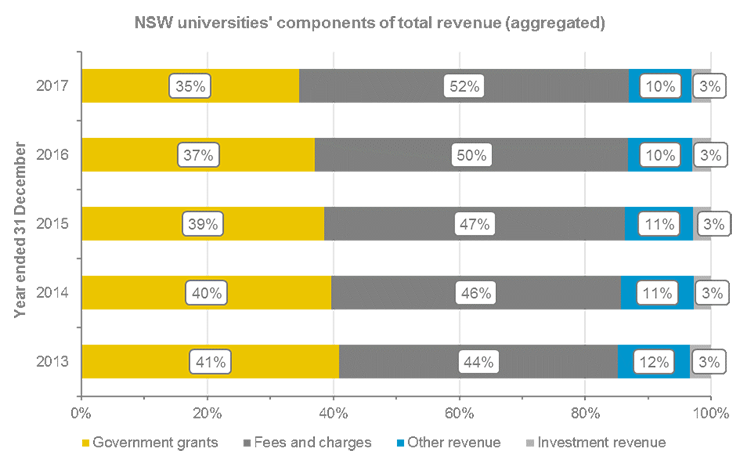
Source: University financial statements (audited).
The following graph shows major revenue components for individual universities for 2017.

Source: University financial statements (audited).
For two universities, government grants represented over 45 per cent of their total revenues (2016: four universities). These two universities are in regional locations which has made it more difficult for them to attract overseas students. Consequently, they have been unable to leverage revenue growth from that source to the same extent as other NSW universities.
Fees revenue from overseas students is growing faster than that from domestic students
NSW universities' total course fee revenue from overseas students continues to grow and exceeded the total course fee revenue from domestic students in 2017 by 36.9 per cent. The rate of increase is due to growth in both the numbers of overseas students and the fees from courses in which they are enrolled.
Overseas student course fees increased for all NSW universities in 2017 and represented 28.1 per cent of the aggregated total revenue (24.4 per cent in 2016). This was an increase of $526 million (or 22.9 per cent) from the previous year to $2.8 billion in 2017.
Total revenue from domestic students increased by $49.9 million (2.5 per cent) in 2017. Domestic student revenue has increased at a lower growth rate, mainly because fees for Commonwealth Supported Places are regulated.

Source: University financial statements (audited).
The graph below shows NSW universities' revenue in 2017 from overseas and domestic students, including government grants for domestic students. The percentages in the graph indicate each university's share of overseas student course fee revenue in the sector. Two universities attracted 52 per cent of total overseas student course fee revenue.

Source: University financial statements (audited).
Thirty-seven per cent of NSW universities' total student revenues came from overseas students from four countries
Overseas students have contributed $2.8 billion to the NSW university sector alone. Of this significant contribution, students from four countries have contributed $1.8 billion. This revenue is so significant it represents 87.4 per cent of the revenues contributed by domestic students, who contributed $2.1 billion to the NSW university sector.
Course fee revenues from overseas students increased by 22.9 per cent in 2017 whilst revenue from domestic students increased by 2.5 per cent. Revenue from overseas students from the top four countries of origin comprised 37 per cent of total student revenues for all NSW universities, or 63.9 per cent of total overseas student revenues in 2017. This leaves those universities that are most dependent on revenue from students from those countries at risk if demand shifts unexpectedly because of changes in political policy, or economic conditions, or if visa requirements change.

The top countries of origin of overseas student enrolment numbers at NSW universities are set out below. All universities are marketing their educational products in international markets, mostly capitalising on Australia's location in Asia. However, while the total number of overseas students has increased, and their country of origin has diversified, there is a clear concentration risk with over 54 per cent of all overseas students sourced from a single country of origin.

The highest proportion of overseas student revenue sourced from a single country at individual NSW universities ranged from 19 to 71 per cent. The graph below illustrates the relative reliance of each NSW university on a single country for their overseas student revenue.

Source: Provided by universities (unaudited).
Universities that have not sufficiently diversified the country of origin of their overseas students will be more sensitive to political and economic changes in the countries they rely upon for their intake, and their revenues may suffer as a result.
Total research income for NSW universities was $1.1 billion in 2016
NSW universities' total research income increased by 9.8 per cent in the four years between 2012 and 2016 from $963 million to $1.1 billion.
The following graph shows the movement of all NSW universities' research income over the past five years.

Two universities attracted 65.2 per cent of the total research income received by all NSW universities, as shown in the graph below.

Other revenues
Total philanthropic revenue increased by 1.0 per cent to $151 million in 2017
NSW universities and many of their controlled entities are not-for-profit charities and registered deductible gift recipients for taxation purposes. They attract significant donations and bequests from public, private and corporate philanthropists directly or indirectly through their foundations.
The graph below presents the aggregated philanthropic revenue received by NSW universities.

Universities with a strong alumni fare better in their philanthropy efforts. The graph below presents the donations revenue received by each of the NSW universities in 2017. Two universities attracted 76.8 per cent of the total philanthropic dollars received by all NSW universities. The newer, smaller universities and non-metropolitan universities have been least able to attract philanthropic dollars in the form of donations and bequests. These universities have also been least able to participate in the growth in revenues from overseas students.
The graph below presents the philanthropic revenue for each NSW university in 2017.

Average investment returns fell from 7.0 per cent in 2013 to 5.8 per cent in 2017
NSW universities assess their investment performance against targets, which are set over a long-term horizon, generally a period of seven to ten years. Universities' investment income is comprised of interest, dividends and franking credit refunds, and distributions. We have used investment return divided by the average investment balance to assess investment performance.
NSW universities manage over $5.4 billion ($3.5 billion in 2013) of investments and earned $313 million in 2017 ($244 million in 2013). Low interest rates have seen the universities' average investment return over the past five years fall from 7.0 per cent in 2013 to 5.8 per cent in 2017. The trend has been consistent with general market conditions.
Universities have allocated more investments into non-fixed income assets
In a prolonged low interest rate environment, universities have allocated proportionally more of their investments into non-fixed income assets (e.g. listed and unlisted securities, managed investment funds and unit trusts), which have earned higher returns than cash assets.

Over the last five years, universities have increased their investment in non-fixed income assets by 67.1 per cent, while fixed income assets increased by 46.3 per cent. However, managing non-fixed income investment portfolios involves greater risk, and requires greater expertise and effective performance monitoring.
The graph below compares the universities' average investment returns in percentage and dollars for the past five years.

Source: University financial statements (audited).
Optimising the return on investments has been challenging in an environment where the average cash rate has only been 2.0 per cent. In addition, universities' investment management frameworks must ensure sufficient cash is available for operational or capital renewal needs, and managing market risk with earning higher returns.
The graph below shows the average investment balances and investment returns for individual universities for 2017. The overall return for individual universities varied between 2.7 per cent to 8.7 per cent, mainly due to the relative weighting in investment portfolios of fixed and non-fixed income investments. Two universities' investment funds represent 52.3 per cent of the total investment funds of all NSW universities combined.

Source: University financial statements (audited).
Most NSW universities have established investment governance frameworks
Investment governance comprises setting specific and measurable investment objectives, managing risk in the selection of investment options, monitoring the performance of investments and formulating a liquidity management plan.
Eight universities have investment management frameworks, which include investment committees, strategies, policies and performance monitoring. Two universities with smaller and less complex investments manage their investments without dedicated investment committees. One university's investment portfolio has only two asset classes, and the other university's finance committee oversees its investment activities.
Financial sustainability indicators
Managing operating expenditure effectively is important for universities to optimise financial outcomes and enhance operational cost efficiencies in a competitive environment.
We have defined operating expenditure in this report as total expenses excluding interest, tax, depreciation, amortisation, and loss on disposal of assets. Operating revenue is defined as total revenue excluding investment income, donations and gains on disposal of assets. One EFTSL is an equivalent full-time study load for one year.
The graph below shows key components of operating expenditure over the past five years for all NSW universities.

The increase in employee related expenses is disclosed in the boxes.
Source: University financial statements (audited).
Total operating expenditure for all universities increased to $8.6 billion in 2017 from $6.8 billion in 2013, a rise of 27.0 per cent. During this period, the total number of equivalent full-time student number increased to 279,320 in 2017 from 257,795 in 2013, an increase of 8.4 per cent.
Employee related expenses at universities is a significant contributor to total operating expenditure. It has grown at an annual average growth over five per cent.
The average annual increase in scholarships and grant expenses grew by 6.7 per cent, consultancy expenses grew by 9.0 per cent, and other operating expense grew by 6.5 per cent, which all contributed to the growth in the total operating expenditure.
The graph below shows the key components of operating expenditure for each university in 2017.

Source: University financial statements (audited).
Employee related expenses represented the major portion of expenses and ranged between 55 per cent to 65 per cent of the total operating expenditure for individual universities.
Operating expenditure per equivalent full-time student load increased in 2017
In 2017, NSW universities incurred an average operating expenditure of $28,904 ($28,062 in 2016) for every EFTSL. This represents an increase of 3.0 per cent from 2016 and 16.8 per cent from 2013.
The graph below compares movement of average operating expenditure per EFTSL, average operating revenue per EFTSL, and total EFTSL, over the past five years for all NSW universities.
Whilst there has been an increase in the number of EFTSL over this period, the average operating expenditure per equivalent full-time student has not decreased. The universities that have been able to attract international students to grow their operational revenues have been able to leverage economies of scale to maximise their average margin per EFTSL. Other universities have had to rely on containing costs to achieve higher EFTSL margins.

Source: Operating expenditure and operating revenue are based on University financial statements (audited). EFTSL numbers are provided by universities (unaudited).
Over the last five years, the margin between average operating revenue per EFTSL and average operating expenditure per EFTSL has increased from $2,945 per EFTSL in 2013 to $3,218 per EFTSL in 2017 (9.3 per cent). However, the margin decreased from $3,418 per EFTSL in 2016 to $3,218 per EFTSL in 2017 (5.9 per cent).
As the margin between operating revenue and operating expenditure decreases, operational results are more at risk from unexpected fluctuations, such as political or economic change that impact overseas student enrolments.
Smaller operating margins reduce the funds available to invest in upgrading infrastructure and implement corporate strategies to meet future challenges.
The rate of increase in operating expenditure over the last five years of 16.8 per cent has exceeded the rate of increase in operating revenue of 16.0 per cent. This has not increased the NSW universities' funding available for non-operational expenditure such as renewal of infrastructure assets or debt servicing.
Operating margin percentage
A university’s operating margin percentage is determined by operating result divided by operating revenue, excluding donations and gains/losses on disposal of assets. Operating result is net result before interest, tax, depreciation and amortisation.
For six universities, the growth in operating expenditure has exceeded the growth in operating revenue, reducing operating margins. The risk associated with narrowing margins is compounded where universities have a high reliance on student revenues from a single source. Sudden changes in demand can challenge the ability of those universities to adjust their cost structures.
The operating margin for each NSW university in 2017 is shown below.

Source: University financial statements, as adjusted (audited).
Operating margins allow universities to implement the priorities in their corporate strategies, meet current and future spending commitments, provide quality education, invest in future growth and renew their infrastructure and technologies. Domestic student numbers grow incrementally and grant revenue appears unlikely to increase given the funding freezes announced. Leveraging overseas markets has increased student revenues, but only at a limited number of universities. In this environment containing operating costs, and particularly overheads, becomes a priority.
Current ratio
Eight universities have current ratios greater than one in 2017
The current ratio measures an entity’s ability to meet short-term obligations as and when they fall due. A ratio of less than one indicates that current liabilities exceed current assets.
High current ratios mean individual universities may have opportunities to manage their cash requirements to optimise their income from investments. Low current ratios mean those universities need to actively manage their cash to meet current obligations.
The current ratio for each NSW university for 2017 is shown below.

Source: University financial statements, as adjusted (audited).
At 31 December 2017, two universities (two universities in 2016) had current ratios of less than one. Both universities have sources of funds for their short-term cash requirements. Southern Cross University has access to an unused bank loan facility at 31 December 2017 to meet its short‑term obligations, and the University of Newcastle can liquidate $437 million of non-current investments.
Liquidating investments to cover operating shortfalls reduces future income from investment returns. Drawing down debt increases borrowings and the cost of that debt needs to be serviced from annual revenues, which narrows operating margins. Where debt is used to pay debt, and borrowings increase on an ongoing basis, it can threaten an organisation's financial sustainability.
Controlled entities
Overall financial performance of controlled entities operating business activities decreased in 2017
Out of 58 controlled entities operating business activities, 16 entities reported losses in 2017 (15 in 2016). These controlled entities include dormant entities but exclude foundations whose primary purpose is fundraising and collecting philanthropic revenue.
The total profit of controlled entities operating business activities decreased 5.5 per cent to $77.5 million in 2017 from $82.6 million in 2016.
Eighteen universities' controlled entities required letters of financial support from their parent in 2017 (19 in 2016). Some controlled entities do not trade, but act as corporate trustees. Other entities have ceased to operate due to business rationalisation. Some universities have started to streamline and reduce the number of their controlled entities to reduce administrative and compliance costs.
The table below details the combined net results of those NSW universities' controlled entities that operate business activities.
| University at 31 December 2017 | Total no. of controlled entities | No. of dormant entities | Total profit/(loss) for 2017 ($m) | No. of entities reporting a profit | No.of entities reporting a loss |
| Controlled entities operating business activities | |||||
| Charles Sturt University | 1 | -- | 0.2 | 1 | -- |
| Macquarie University | 14 | 7 | 7.7 | 4 | 3 |
| Southern Cross University | 1 | -- | (0.4) | -- | 1 |
| University of New England | 4 | 1 | (0.8) | 1 | 2 |
| University of NSW | 11 | -- | 49.9 | 6 | 5 |
| University of Newcastle | 2 | -- | (0.2) | 1 | 1 |
| University of Sydney | 6 | -- | 2.4 | 4 | 2 |
| University of Technology Sydney* | 7 | -- | (5.0) | 4 | 2 |
| University of Wollongong | 8 | 2 | 5.6 | 6 | -- |
| Western Sydney University | 4 | 1 | 3.5 | 3 | -- |
| Total | 58 | 11 | 62.9 | 30 | 16 |
Source: University and controlled entities' financial statements (audited).
4. Teaching and research
Teaching and research are key objectives of universities and they invest most of their resources in achieving high quality academic and research outcomes to maintain or advance their reputations and rankings in Australia and abroad. Universities have also committed to achieving certain government objectives.
This chapter outlines teaching and research outcomes for NSW universities for 2017.
| Observation | Conclusion or recommendation |
| 4.1 Teaching outcomes | |
| Achieving Australian Government target | |
| NSW universities met the Australian Government target of having 40 per cent of 25 to 34 year-olds with bachelor degrees ten years earlier than the original target date of 2025. |
The proportion of 25 to 34 year-olds in NSW holding a bachelor degree increased to 43.4 per cent in 2017. In 2009, when the target was originally set, only 35.5 per cent of 25 to 34 year-olds held a bachelor degree. |
| Graduate employment rates | |
|
Seven universities exceeded the national average of 71.8 per cent for the proportion of their undergraduates who obtain full-time employment. Four universities achieved better than the national average of 86.1 per cent for the proportion of their postgraduates who obtain full-time employment. |
Most NSW universities' employment outcomes are better than the national average. |
| Student enrolments by field of education | |
| NSW universities have increased enrolments in fields of study that align with known skills shortages in NSW identified by the Australian Government for 2016 and 2017. | Alignment of student intake with identified shortages helps ensure graduates secure timely employment on completion of their studies. |
| Achieving diversity outcomes | |
|
NSW universities agreed to targets set by the Australian Government for enrolments of students from low socio economic status (SES) and Aboriginal or Torres Strait Islander backgrounds. |
NSW universities can improve outcomes for these students by implementing policies to increase enrolments and support students to graduation. |
|
Three universities exceeded the target of 20 per cent of low SES student enrolments in 2017. Six universities met their Indigenous student enrolment target in 2017. The target is having a growth rate in the enrolment of Indigenous students that is more than 50 per cent higher than the growth rate of non-Indigenous student enrolments. |
At the current rate, it is unlikely most universities will reach the agreed low SES target by 2020. |
4.1 Teaching outcomes
Achieving Australian Government targets
NSW universities met the Australian Government target for 25 to 34 year-olds holding bachelor degrees
NSW universities achieved the Australian Government's target of having 40 per cent of NSW's population of 25 to 34 year-olds with a bachelor or higher degree by 2015, ten years earlier than the original target date of 2025.
The target has been maintained in 2016 and 2017 with 41.9 and 43.4 per cent respectively of NSW's 25 to 34 year-olds with bachelor or higher degrees, boosted by the overall increase in domestic student enrolments and immigration of undergraduates.
The Australian Government's de-capping of student numbers in 2009 allowed NSW universities to increase domestic student enrolments by 58.3 per cent to 100,309 in 2016 (63,346 in 2009).

Graduate employment rates
Most NSW universities' employment outcomes are better than the national average
NSW universities use data published by surveys conducted by the Department of Education's providers to assess the employment outcomes of their graduates.
According to the survey results, seven out of ten universities performed better than the national average of 71.8 per cent for full-time employment rates of their undergraduates. The national average includes employment outcomes from other tertiary education institutions such as TAFE and colleges that provide other Vocational Education and Training qualifications.
Four universities performed better than the national average of 86.1 per cent for full-time employment outcomes of their postgraduates.
The graph below presents the results of the 2017 survey.

Student enrolments by field of education
NSW universities have increased enrolments in fields of study that align with known skills shortages in NSW
Aligning enrolments with identified skills shortages helps ensure students secure employment in their desired field of study on completion of their studies on a timely basis. It also provides resources to help address identified skills shortages.
Skills shortages by occupation for NSW for both 2016 and 2017 were identified by the Australian Department of Employment as:
- Architects and surveyors
- Health professionals (sonographers, nurses, audiologists)
- Veterinarians
- ICT professionals.
NSW universities combined have enrolled an additional 7,803 students in the disciplines aligned with identified skills shortages, an increase of 12,048, or 4.5 per cent since 2016. Courses with the highest rates of increased student enrolments included Architecture and Building, IT and Engineering, and Health.
The alignment of enrolments in courses to those identified with skill shortages is illustrated by the graph below.

Source: Provided by universities (unaudited).
Achieving diversity outcomes
In 2009, the Australian Government set targets that by 2020:
- twenty per cent of university undergraduate enrolments are students from low socio‑economic status (SES) backgrounds
- growth rates for enrolments of Aboriginal or Torres Strait Islander students exceed the growth rate of enrolments of non-Indigenous students by at least 50 per cent.
In March 2017, all Australian universities committed to achieving these outcomes and:
- increase the numbers of Aboriginal and Torres Strait Islander people participating in higher education as students, as graduates and as academic and research staff;
- increase the engagement of non-Indigenous people with Indigenous knowledge, culture and educational approaches; and
- improve the university environment for Aboriginal and Torres Strait Islander people.
NSW universities can improve outcomes for these students
The 2017 results for NSW universities showed:
- only three universities achieved enrolments of more than 20 per cent of students from low SES in 2017
- six universities achieved the target growth rate for enrolments of students from Aboriginal and Torres Strait Islander backgrounds in 2017.
NSW universities can improve outcomes for these students by consistently setting targets, tracking achievement against those targets, implementing policies to increase enrolments and supporting students to graduation. The Australian Government is also increasing flexibility in dedicated Indigenous funding programs to help universities achieve outcomes for these students.
Current rates of increase in student enrolments from low SES backgrounds is less than the growth rate of overall student enrolments
NSW universities reported increases in the number of low SES student enrolments of 2.45 per cent to 37,815 in 2017 (36,913 in 2016). Overall student enrolments in NSW increased 4.5 per cent in the same period. Where the growth in low SES students does not exceed the growth in overall student enrolments, the target is unlikely to be achieved.
Actual enrolments of students from low SES backgrounds in 2017 for NSW universities as a percentage of total students is shown in the table below.

Six universities met their targets for enrolments of students from Aboriginal and Torres Strait Islander backgrounds
Enrolments of Aboriginal and Torres Strait Islander students across all NSW universities rose nine per cent to 5,884 in 2017 (5,395 in 2016).
The Indigenous student enrolment growth rate for 2017 by individual university is shown below. The target growth rate is greater than 50 per cent of the growth rate for enrolment of non‑Indigenous students of 4.5 per cent.

Four universities did not meet the target growth rate this year, and will need to increase their efforts if they are to achieve their targets by 2020.
Over the same period Australian Government grants for the Indigenous Student Success Program increased for NSW universities by $5.8 million to $21.3 million in 2017.
5. Financial controls and governance
Appropriate financial controls help ensure efficient and effective use of resources, and the implementation and monitoring of university policies. Governance consists of frameworks, processes and behaviours that enable the universities to operate effectively and comply with relevant laws and policies.
This chapter outlines our audit observations on the financial control and governance of NSW universities for 2017.
| Observation | Conclusion or recommendation |
| 5.1 Internal controls | |
| Internal control findings | |
|
Eighty-three internal control deficiencies were identified during our audits, of which 40 related to Information Technology (IT). |
Recommendation: NSW universities should ensure controls, including information technology controls, are properly designed and operate effectively to protect intellectual property, staff and student data, and assets. Universities should rectify identified deficiencies in a timely manner. |
| Repeat findings Twenty-four findings were repeat internal control deficiencies, of which 18 related to IT. |
IT issues can take some time to rectify because specialist skill and/or partnering with software suppliers is often required to implement new controls. However, until rectified, the vulnerabilities those control deficiencies present can be significant. |
| Cyber security Our audits identified opportunities to improve cyber security controls and processes to reduce risks, including risks relating to financial loss, reputational damage and breaches of privacy laws. |
Recommendation: NSW universities should strengthen their cyber security frameworks to manage cyber security risks. This includes developing:
|
|
Use of credit card and work-related travel The risks of unauthorised use can be mitigated by regular monitoring, and reporting breaches for investigation and disciplinary action. |
Appropriately designed and implemented preventive and detective controls are most effective when enforcement and disciplinary activities are oversighted by university audit and risk committees. |
5.1 Internal controls
Internal controls findings
We identified 83 internal control deficiencies of which 40, including one high risk finding, related to information technology
Information technology (IT) has become increasingly important for universities' financial reporting, and efficient and effective delivery of their services. Our audits focused on universities' controls over their IT systems.
Eighty-three internal control deficiencies were identified during our audits, of which 40 related to IT. The only high risk finding related to storage of unencrypted username and password information on a database with incomplete access restrictions. We performed additional audit procedures to conclude that the control deficiency did not present a risk of material misstatement in the university's financial statements. We reported these matters to those charged with governance through our management letters.
The graph below describes the distribution of our management letter findings by risk rating across five key areas.

Forty-three moderate risk control deficiencies were identified, of which 22 related to IT and 21 related to governance and financial reporting
A summary of moderate risk control deficiencies is set out below.
| Areas | No. of moderate risk control deficiencies | Summary of the control deficiency |
|---|---|---|
| Information Technology | 22 |
IT control deficiencies included:
Poor IT controls increase the risk of inappropriate access, cyber security attacks, data manipulation and misuse of information and assets. |
| Payroll | 7 |
Payroll deficiencies included:
Payroll weaknesses increase the risk of error or fraud in payments to employees. |
| Policy and procedures | 7 |
Policy and procedures deficiencies included:
|
| Financial controls | 5 |
Financial control deficiencies included:
Financial control weaknesses increase the risk of error or fraud in transactions that may result in financial loss to the university or misstatement in financial statements. |
| Financial reporting | 2 |
Financial reporting deficiencies related to:
These increase the risk that the financial statements will be materially misstated, or require correction in subsequent years. |
| Total | 43 |
Twenty-four findings were repeat internal control deficiencies, of which 18 related to IT
We repeated 24 findings identified in previous audits that had not been fully addressed by management by 31 December 2017. Eighteen repeat findings related to IT control deficiencies.
IT issues can take some time to rectify because specialist skill and/or partnering with software suppliers is required to implement appropriate controls. Changes to complex systems or IT architecture may involve extensive testing and assessment before they are put into production. However, until rectified, the vulnerabilities those control deficiencies present can be significant.
Cyber security
Cyber security comprises technologies, processes and controls that are designed to protect IT systems and data from cyber-attacks. The cyber security framework consists of identification, protection, detection, response and recovery of the IT systems.
The increasing global interconnectivity between computer networks has dramatically increased the risk of cyber security incidents. Such incidents can harm universities' service delivery and may include the theft of information, denial of access to critical technology, or even the hijacking of systems for profit or malicious intent.
NSW universities can improve their cyber security controls and processes
Our audits identified one NSW university that does not have a cyber risk framework. Five universities did not maintain a register of cyber incidents. Of those universities that did register cyber incidents, between three to 100 incidents were acknowledged during 2017.
- procedures, protocols and supporting systems to effectively identify, report and respond to cyber security threats and incidents
- staff awareness training and programs, including programs tailored for a range of audiences.
Inconsistent definitions of what a 'cyber incident' is, contributes to under-reporting and a lack of appreciation of the extent of cyber threats. In our 2017 report on government agencies' Internal Controls and Governance', we found attacks identified by agencies had increased 14-fold in three years, and under-reporting meant two agencies alone accounted for more than 82 per cent, or 7,040 reported attacks. The range of reported incidents at universities, between three and 100 incidents, indicates a significant under reporting of incidents.
Ineffective management of cyber security threats and incidents exposes universities to risks including financial loss, reputational damage and loss of information.
Losses can arise from:
- theft of corporate and financial information and intellectual property
- denial of service
- destruction of data
- costs of repairing affected systems, networks and devices
- legal fees and/or legal action from losses arising from denial-of-service attacks causing system downtime in critical systems
- third-party losses when personal information is stolen.
Common cyber security issues identified at NSW universities are detailed below.
| Cyber security issue | Number of universities |
|---|---|
| No cyber risk policy | 1 |
| No cyber incidents register | 5 |
| The university has not assessed the potenial financial and/or operational impact of cyber attacks | 3 |
| A recovery plan following a cyber attack does not exist | 3 |
| Staff are not formally trained in cyber awareness | 8 |
| Cyber resilience was not tested in 2017 | 4 |
Some NSW universities have started introducing cyber security control procedures, including staff training. Those universities incurred approximately $6.0 million in costs to improve their cyber security during 2017.
More consistent and accurate recording and reporting of cyber attacks would help universities to:
- accurately assess the risk they are exposed to
- understand the overall threat and develop appropriate mitigation strategies
- properly implement and resource risk mitigation.
We refer universities to the Australian Signals Directorate (ASD), a Commonwealth authority responsible for cyber and information security's ‘Australian Government Information Security Manual’, which provides guidance on cyber security and governance.
Use of credit card and work-related travel
NSW universities had appropriate published policies on the use of credit cards, and have internal controls and processes to implement those policies
NSW universities provide employees with corporate purchase and taxi cards to facilitate the efficient payment of approved business-related expenses. The average number of cards issued by each university ranges from 200 to 3,000.
We reviewed university policies and internal controls for the use of credit cards and work-related travel expenses. All NSW universities had appropriate published policies on the use of credit cards, and have internal controls and processes to implement those policies. All university credit card policies prohibit the use of corporate credit cards for personal use. Maximum spending limits per card varied for each NSW university from $2,000 to $100,000. Universities restricted the spending limits on credit card so they did not exceed the employee's financial delegation.
University audit and risk committee oversight can reduce the risk of credit card misuse
Appropriately designed and implemented preventive and detective controls are more effective when monitoring, investigation, enforcement and disciplinary activities are oversighted by audit and risk committees.
When possible misuse was reported, one audit and risk committee recently oversighted a review of credit card use and misuse. The review conducted by internal audit examined controls over credit card use, investigated reported instances of misuse and noted disciplinary action. The audit and risk committee was, as a result of their actions, able to determine that the misuse was isolated rather than systemic, and the financial implications were not significant.